
The Brain of a Data Analyst: How Core and Soft Skills Can Transform Small Business Growth
Introduction: Why Data Analysts Are No Longer Just for Big Corporations
Not long ago, the idea of hiring a data analyst felt like a luxury reserved for Fortune 500 companies — the Googles, Amazons, and Microsofts of the world. Small business owners were left navigating their growth journeys with gut instinct, scattered spreadsheets, and the occasional friendly advice from a fellow entrepreneur at a networking event.
That era is over.
Today, data is the most valuable currency in business — and small businesses are sitting on goldmines of it without even realizing it. Every sale, every customer interaction, every website visit, and every social media engagement is a data point waiting to be decoded. The question is no longer whether small businesses need data analysis — it’s whether they truly understand what it takes to do it right.
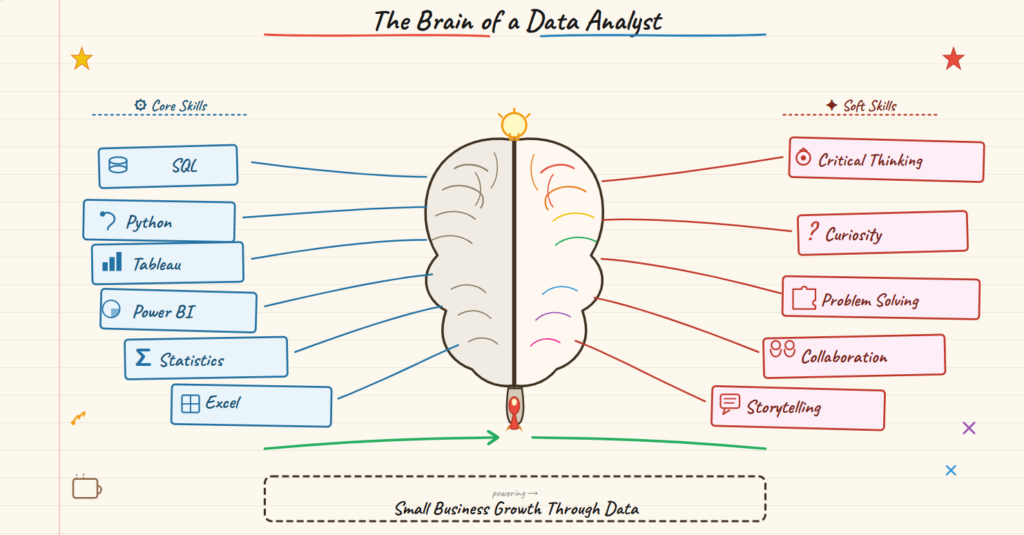
That’s exactly what the “Brain of a Data Analyst” framework reveals. It’s a powerful illustration of the two hemispheres that define a great data analyst: the Core Technical Skills — Tableau, SQL, Python, Statistics, Power BI, and Excel — and the Soft Skills — Critical Thinking, Collaboration, Curiosity, Problem Solving, and Storytelling.
Together, these two sides of the brain don’t just create analysts. They create business growth engines.
In this article, we’ll take a deep dive into each of these skills, explain what they mean in plain language, and — most importantly — show you exactly how they can help your small business grow, compete smarter, and make decisions with confidence.
PART ONE: The Core Skills — The Technical Engine Behind Every Great Analyst
1. Tableau – Turning Numbers Into Visuals That Actually Make Sense (Data Analyst)
What It Is: Tableau is one of the world’s leading data visualization tools. It transforms raw, complex datasets into interactive charts, graphs, dashboards, and maps that anyone — even non-technical team members — can understand at a glance.
The Real-World Picture: Imagine you run a small retail store. Every month, you’re drowning in sales reports — columns and rows of numbers that tell you something, but you’re not quite sure what. With Tableau, that same data becomes a colour-coded dashboard showing you which products fly off the shelf on weekends, which customer age group spends the most, and which store location underperforms during certain months.
How It Helps Small Businesses Grow: For small businesses, clarity is power. When you can see your business performance visually rather than decoding spreadsheets, you make faster and better decisions. A Tableau-equipped analyst can help you:
- Identify your most profitable products or services without spending hours in spreadsheets
- Track marketing campaign performance in real time so you know what’s working and what’s wasting your budget
- Monitor cash flow trends visually, helping you spot financial risks before they become crises
- Present data to investors or stakeholders in a compelling, professional format that builds trust
Small businesses that adopt visual analytics tools like Tableau report faster decision-making cycles and significantly fewer costly mistakes driven by misread data. When you can see your business clearly, you can steer it confidently.
2. SQL – The Language That Unlocks the Secrets Hidden in Your Data (Data Analyst)
What It Is: SQL (Structured Query Language) is the foundational language used to communicate with databases. It allows analysts to retrieve, filter, sort, and manipulate data stored in relational databases quickly and precisely.
The Real-World Picture: Every time a customer buys from your online store, books an appointment, or fills out a contact form, that data goes somewhere — into a database. SQL is the tool that lets an analyst ask that database intelligent questions: “How many customers bought Product A but never returned for a second purchase?” or “Which zip codes generate the highest average order value?”
Without SQL, that data just sits there, silent and untapped.
How It Helps Small Businesses Grow: SQL might sound intimidating, but its value for small businesses is immense and very practical:
- Customer segmentation: SQL allows you to group customers by purchase history, geography, demographics, or behavior — enabling hyper-targeted marketing that converts better
- Inventory management: Query your inventory database to identify slow-moving stock, prevent overstocking, and reduce waste
- Churn analysis: Find out which customers haven’t returned in 90 days and trigger a re-engagement campaign before you lose them permanently
- Financial reporting: Pull precise financial data quickly instead of manually compiling reports — saving hours of work every month
For a small business owner who wears ten hats at once, having an analyst who speaks SQL fluently means you get the exact answers you need, exactly when you need them.
3. Python – The Swiss Army Knife of Data Analysis (Data Analyst)
What It Is: Python is a versatile, beginner-friendly programming language that has become the gold standard in data science and analysis. From cleaning messy datasets to building predictive models, Python does it all.
The Real-World Picture: Let’s say you run a small e-commerce business and you want to predict which products will be in high demand next quarter. A data analyst with Python skills can build a forecasting model using your historical sales data — no expensive third-party software required — and give you a reliable projection that helps you order inventory smarter.
Or perhaps you’re getting hundreds of customer reviews every week. Python can automatically scan and analyse all those reviews for sentiment — telling you what customers love, what frustrates them, and what they wish you offered.
How It Helps Small Businesses Grow: Python brings enterprise-level analytical capabilities to small business budgets:
- Automate repetitive tasks: Python can automate data cleaning, reporting, and email campaigns — freeing up hours of manual work every week
- Predictive analytics: Forecast sales, demand, and customer behaviour to make proactive rather than reactive business decisions
- Web scraping: Monitor competitor pricing, track market trends, and gather industry intelligence automatically
- Customer sentiment analysis: Understand what your customers are really saying across reviews and social media
The return on investment from Python-powered analysis can be remarkable for small businesses. You get smarter insights, faster — without the overhead of expensive enterprise software.
4. Statistics – The Science of Making Confident Business Decisions (Data Analyst)
What It Is: Statistics is the mathematical foundation of data analysis. It involves collecting, analysing, interpreting, and presenting data in ways that reveal meaningful patterns and support sound decision-making.
The Real-World Picture: You’ve just run two versions of an email marketing campaign — one with a blue button and one with a green button. Both seem to perform similarly. Should you trust that gut feeling, or should you run a statistical significance test to confirm which one truly performs better? Statistics gives you that certainty.
How It Helps Small Businesses Grow: Many small business owners make decisions based on incomplete or misinterpreted data. Statistics introduces rigour and confidence:
- A/B testing: Statistically validate which version of your website, pricing, or campaign performs better before fully committing
- Understanding customer lifetime value (CLV): Use statistical models to calculate how much a customer is worth over time — and how much you can afford to spend acquiring them
- Risk assessment: Evaluate the likelihood of different business outcomes before making major investments
- Market research: Analyse survey results and customer feedback in ways that remove bias and surface genuine insights
A small business that makes statistically informed decisions doesn’t gamble — it invests intelligently.
5. Power BI – Your Business Intelligence Command Centre (Data Analyst)
What It Is: Power BI is Microsoft’s business intelligence platform that connects to multiple data sources and creates rich, interactive reports and dashboards. It integrates seamlessly with tools many small businesses already use, like Excel, SharePoint, and Microsoft 365.
The Real-World Picture: Imagine having a single dashboard on your screen every morning that shows you yesterday’s revenue, your top-selling products, your website traffic, your social media performance, and your stock levels — all updated in real time, all in one place. That’s Power BI.
How It Helps Small Businesses Grow: Power BI is arguably one of the most accessible yet powerful tools available for small businesses:
- Unified business overview: Connect sales data, marketing metrics, financial reports, and operations into one single view — no more switching between tools and tabs
- Real-time monitoring: Spot problems as they happen rather than discovering them weeks later in a monthly report
- Cost efficiency: Power BI is significantly more affordable than enterprise BI platforms, making it ideal for small business budgets
- Accessible reporting: Share easy-to-understand reports with your team, investors, or accountants — no technical background required to read them
For a small business owner who needs clarity without complexity, Power BI is one of the most valuable investments you can make in your analytical infrastructure.
6. Excel – The Timeless Workhorse That Still Delivers (Data Analyst)
What It Is: Microsoft Excel has been the backbone of business data management for decades. From basic spreadsheets to advanced pivot tables and financial modelling, Excel remains one of the most widely used analytical tools in the world.
The Real-World Picture: Most small business owners already use Excel in some capacity. But a data analyst doesn’t just use Excel — they master it. They build dynamic financial models, automated dashboards, complex formulas, and macros that turn hours of manual work into minutes.
How It Helps Small Businesses Grow: Excel’s depth is often underestimated. In the hands of a skilled analyst, it becomes a powerful growth tool:
- Financial modelling: Build cash flow forecasts, profit and loss projections, and break-even analyses to guide your financial planning
- Sales tracking: Monitor sales performance by rep, region, or product category with dynamic pivot tables
- Budget management: Create and manage budgets with real-time variance tracking — know immediately when you’re overspending
- Inventory control: Track stock levels, reorder points, and supplier performance in a well-structured Excel model
For businesses not yet ready to invest in premium BI tools, a skilled Excel analyst can extract extraordinary value from data you already have.
PART TWO: The Soft Skills — The Human Intelligence That Makes Data Meaningful
Technical tools are only as powerful as the human intelligence directing them. This is where the right side of the analyst’s brain comes in — the soft skills that separate a data processor from a data strategist.
7. Critical Thinking – Asking the Right Questions Before Trusting the Answers (Data Analyst)
What It Is: Critical thinking is the ability to analyse information objectively, question assumptions, identify biases, and evaluate evidence before drawing conclusions. It is the intellectual quality that prevents analysts from being misled by data that looks right but isn’t.
The Real-World Picture: Data can lie — or rather, it can mislead if interpreted without critical thinking. A spike in website traffic might look like great news until a critical thinker asks, “Is this genuine customer interest, or a bot attack?” A month of record sales might seem like a growth trend until someone asks, “Did we run a one-time promotion that inflated these numbers?”
How It Helps Small Businesses Grow: Critical thinking protects small businesses from costly mistakes:
- Avoiding vanity metrics: Not every impressive-looking number is meaningful. Critical thinkers separate metrics that matter from ones that just look good
- Smarter problem diagnosis: Before throwing money at a problem, critical thinking helps identify the root cause rather than treating symptoms
- Evaluating business opportunities: Rigorously assess new ventures, partnerships, or market expansions before committing resources
- Challenging the status quo: Question existing processes and assumptions to uncover hidden inefficiencies
In a small business, where every decision carries significant financial weight, critical thinking is not optional — it is essential.
8. Collaboration – Because Data Has No Value in Isolation (Data Analyst)
What It Is: Collaboration is the ability to work effectively across teams, departments, and stakeholders — translating technical findings into language that resonates with marketing, sales, operations, finance, and leadership.
The Real-World Picture: An analyst who produces a brilliant report but can’t communicate it clearly to the rest of the business is like a lighthouse that no one can see. Collaboration bridges the gap between data and action.
How It Helps Small Businesses Grow: In a small business, where teams are lean and every person wears multiple roles, collaboration is the glue that makes data-driven decisions stick:
- Cross-functional alignment: When the analyst works closely with sales, marketing, and operations, insights get acted upon faster
- Better data collection: Collaboration ensures that the right data is being captured from every corner of the business — not just what’s convenient to measure
- Shared ownership of outcomes: When teams are involved in the analytical process, they’re more invested in implementing the recommendations
- Faster problem resolution: Collaborative analysts resolve business challenges more efficiently because they bring multiple perspectives to the table
For a small business owner, an analyst who is a great team player multiplies the value of their technical skills significantly.
9. Curiosity – The Fuel That Drives Discovery (Data Analyst)
What It Is: Curiosity is the innate drive to ask “why”, explore “what if”, and dig deeper when the surface-level answer doesn’t feel complete. It is the quality that leads analysts to uncover insights that no one thought to look for.
The Real-World Picture: A curious analyst doesn’t just answer the questions you ask — they find the questions you didn’t know to ask. They notice an unusual pattern in the data late on a Friday afternoon and stay to investigate because something doesn’t add up. That investigation might reveal a product defect, a billing error, or a hidden market opportunity.
How It Helps Small Businesses Grow: Curiosity is one of the most undervalued growth drivers in small business:
- Uncovering hidden opportunities: Curious analysts spot micro-trends in your data before they become macro shifts — giving you first-mover advantage
- Continuous improvement: A culture of curiosity leads to constant questioning of what can be done better, faster, and cheaper
- Innovation: By exploring data from different angles, curious analysts surface ideas for new products, services, or customer experiences
- Competitive intelligence: Curious analysts are naturally drawn to understanding the broader market context — including what your competitors are doing
In business, the most dangerous phrase is “that’s how we’ve always done it.” Curiosity is the antidote.
10. Problem Solving – From Insight to Action (Data Analyst)
What It Is: Problem solving is the structured ability to identify a business challenge, analyse its root causes, generate potential solutions, and implement the most effective one. In data analysis, it means turning complex findings into clear, actionable recommendations.
The Real-World Picture: Your small restaurant business is seeing a decline in weekday lunchtime customers. An analyst with strong problem-solving skills doesn’t just report the decline — they dig into the data, identify that customers are leaving after 30 minutes without ordering a second item, hypothesize that the menu lacks mid-range options, test that hypothesis, and recommend a targeted menu change. That’s problem solving in action.
How It Helps Small Businesses Grow: For small businesses operating with limited resources, efficient problem solving is a competitive superpower:
- Faster resolution of operational issues: Identify bottlenecks in your processes — from order fulfilment to customer service — and eliminate them systematically
- Revenue recovery: Identify where you’re losing money and why — whether through pricing errors, customer churn, or inefficient supplier contracts
- Strategic planning: Use data-driven problem solving to evaluate business strategies and pivot quickly when market conditions change
- Customer retention: Diagnose why customers leave and implement targeted solutions to improve loyalty and lifetime value
A small business with a problem-solving analyst on its side doesn’t just fix today’s challenges — it builds resilience for tomorrow’s.
11. Storytelling – Making Data Human, Memorable, and Actionable (Data Analyst)
What It Is: Data storytelling is the art of combining data, visuals, and narrative to communicate insights in a way that is compelling, clear, and drives action. It is arguably the most powerful soft skill an analyst can possess.
The Real-World Picture: You can have the most sophisticated analysis in the world — but if it’s presented as a 40-slide deck of charts and tables, decision-makers will glaze over and nothing will change. Great storytellers take the same data and craft it into a narrative: “Here’s where we were, here’s what happened, here’s why it matters, and here’s exactly what we should do next.”
How It Helps Small Businesses Grow: In small businesses, where decisions are often made by people without deep analytical backgrounds, storytelling is what makes data matter:
- Investor presentations: Communicate your business performance and growth potential compellingly to attract funding
- Team alignment: Help your team understand why certain strategies are being pursued — driving engagement and accountability
- Customer communication: Use data stories in your marketing to build credibility and trust with your audience
- Board or partner reporting: Present business results in a narrative format that is easy to understand and hard to ignore
Data without a story is just noise. Data with a story is a decision-making tool. For small businesses looking to scale, the ability to tell compelling data stories is nothing short of transformational.
PART THREE: Bringing Both Hemispheres Together — The Analyst Who Grows Your Business
The magic of the “Brain of a Data Analyst” framework lies not in any single skill, but in the combination of both hemispheres working in harmony.
An analyst who is technically brilliant but cannot communicate insights is only half effective. An analyst who is a great collaborator and storyteller but lacks technical depth will produce compelling reports built on shaky foundations.
The most valuable analyst for a small business is one who: (Data Analyst)
✅ Can extract and query data confidently using SQL and Python
✅ Can visualize findings beautifully in Tableau, Power BI, or Excel
✅ Applies statistical rigour to validate conclusions
✅ Thinks critically before trusting surface-level findings
✅ Asks curious questions that uncover hidden opportunities
✅ Solves problems systematically and recommends clear actions
✅ Collaborates across teams to ensure insights lead to outcomes
✅ Tells stories that make data accessible and actionable for every stakeholder
PART FOUR: A Practical Roadmap — How Small Businesses Can Start Leveraging These Skills Today
You don’t need to hire a full-time team of analysts to start benefiting from the Brain of a Data Analyst framework. Here’s a practical roadmap for small businesses at different stages:
Stage 1 – The Foundation (Budget: Minimal) Start with what you have. Invest in building your Excel capability — or hire a part-time analyst or freelancer who can build clean, organised data systems for your business. Ensure you’re consistently collecting the right data from your sales, marketing, and operations.
Stage 2 – The Intelligence Layer (Budget: Moderate) Introduce Power BI or Tableau to your reporting. Connect your sales, marketing, and financial data into a unified dashboard. Begin asking structured analytical questions about your customer behaviour, product performance, and operational efficiency.
Stage 3 – The Growth Engine (Budget: Growing) Bring in Python and SQL capabilities — either through upskilling your team or hiring a data analyst. Begin building predictive models, automating routine reports, and running statistically validated experiments on your pricing, marketing, and product strategy.
Stage 4 – The Competitive Advantage (Budget: Scaling) At this stage, data analysis becomes a core strategic function of your business. You’re not just reporting on what happened — you’re predicting what will happen, experimenting continuously, and using data storytelling to align your entire organisation around a shared vision for growth.
Conclusion: The Brain Your Business Has Been Missing
In an era where data is generated at every customer touchpoint, the small businesses that thrive will be those that learn to listen to what that data is saying.
The “Brain of a Data Analyst” is not just an infographic — it’s a blueprint for building a data-driven culture inside your business. Whether you’re a solo entrepreneur managing your own spreadsheets, or a growing small business ready to hire your first analyst, understanding these eleven skills — both technical and human — will transform the way you see your business.
Because at the end of the day, data doesn’t grow businesses. People who understand data grow businesses.
And now, you know exactly what that understanding looks like.





One Comment